10 million Nginx logs

Intro
In this article we’ll observe another test added to https://db-benchmarks.com/ - 10+ million standard HTTP logs collected by Nginx on ecommerce website zanbil.ir.
Data collection
We found the data collection on https://www.kaggle.com/datasets/eliasdabbas/web-server-access-logs and found it very interesting to make a test with since the dataset represents a very standard nginx http access log. Here’s an example:
|
|
Probably most of web sites in the Internet have a similar log. Many website admins and devops want to be able to process logs like this to do filtering and analytics.
After parsing by the framework there are 11 fields in the log:
- 7 string fields
- 4 integer fields
The whole list of fields and their data types is:
|
|
We preliminarily convert the raw log to CSV so it’s easier to load to different databases and search engines.
Databases
So far we have made this test available for 3 databases:
- Clickhouse - a powerful OLAP database,
- Elasticsearch - general purpose “search and analytics engine”,
- Manticore Search - “database for search”, Elasticsearch alternative.
In this test we make as little changes to database default settings as possible to not give either of them an unfair advantage. Testing at max tuning is no less important, but it’s a subject for another benchmark. Here we want to understand what latency a regular non-experienced user can get after just installing a database and running it with its default settings. But to make it fair to compare one with another we still had to change a few settings:
- Clickhouse: no tuning
, just
CREATE TABLE ... ENGINE = MergeTree() ORDER BY idand standard clickhouse-server docker image. - Elasticsearch: we test in 2 modes:
- with no tuning at all which is probably what most users do
- with number of shards equal to the number of CPU cores on the server, so Elasticsearch can utilize the CPUs more efficiently for lower response time, since as said in Elasticsearch official guide “Each shard runs the search on a single CPU thread”. The dataset size is only 3.5 GB, so it’s not clear if it’s required or not, but that’s why we are testing it.
bootstrap.memory_lock=truesince as said on https://www.elastic.co/guide/en/elasticsearch/reference/current/docker.html#_disable_swapping it needs to be done for performance.- the docker image is standard
- Manticore Search is used in a form of their official docker image + the columnar library they provide
:
- we test Manticore’s default row-wise storage
- and columnar storage since Elasticsearch and Clickhouse don’t provide row-oriented stores and it may be more fair to compare with Manticore running in this mode.
- we added
secondary_indexes = 1to the config which enables secondary indexes while filtering (when loading data that’s built anyway). Since Elasticsearch uses secondary indexes by default and it’s fairly easy to enable the same in Manticore it makes sense to do it. Unfortunately in Clickhouse user would have to make quite an effort to do the same, hence it’s not done, since it would then be considered a heavy tuning which would then require further tuning of the other databases which would make things too complicated and unfair.
About caches
We’ve also configured the databases to not use any internal caches. Why this is important:
- In this benchmark, we conduct an accurate latency measurement to find out what response time users can expect if they run one of the tested queries at a random moment, not after running the same query many times consequently.
- Any cache is a shortcut to low latency. As written in Wikipedia
“cache stores data so that future requests for that data can be served faster”. But caches are different, they can be divided into 2 main groups:
-
👌 those that just cache raw data stored on disk. For example many databases use
mmap()to map the data stored on disk to memory, access it easily and let the operating system take care about the rest (reading it from disk when there’s free memory, removing it from memory when it’s needed for something more important etc). This is ok in terms of performance testing, because we let each database leverage the benefit of using the OS page cache (or its internal similar cache that just reads data from disk) That’s exactly what we do in this benchmark. -
❗ those that are used to save results of previous calculations. And it’s fine in many cases, but in terms of this benchmark letting database enable such a cache is a bad idea, because:
- it breaks proper measuring: instead of measuring calculation time you start measuring how long it takes to find a value by a key in memory. It’s not something we want to do in this test (but it’s interesting in general and we’ll perhaps do it in the future and publish some article “Benchmark of caches”).
- even if they save not a full result of a particular query, but results of its sub-calculations it’s not good, because it breaks the idea of the test - “what response time users can expect if they run one of the tested queries at a random moment”.
- some databases have such a cache (it’s usually called “query cache”), others don’t so if we don’t disable database internal caches we’ll give an unfair advantage to those having that.
So we do everything to make sure none of the database does this kind of caching.
-
What exactly we do to achieve that:
- Clickhouse:
SYSTEM DROP MARK CACHE,SYSTEM DROP UNCOMPRESSED CACHE,SYSTEM DROP COMPILED EXPRESSION CACHEbefore testing each new query (not each attempt of the same query).
- Elasticsearch:
"index.queries.cache.enabled": falsein its configuration/_cache/clear?request=true&query=true&fielddata=truebefore testing each new query (not each attempt of the same query).
- Manticore Search (in configuration file):
qcache_max_bytes = 0docstore_cache_size = 0
- Operating system:
- we do
echo 3 > /proc/sys/vm/drop_caches; syncbefore each NEW query (NOT each attempt). I.e. for each new query we:- stop database
- drop OS cache
- start it back
- make the very first cold query and measure its time
- and make tens more attempts (up to 100 or until the coefficient of variation is low enough to consider the test results high quality)
- we do
Queries
The queries are mostly analytical that do filtering, sorting and grouping, but we’ve also included one full-text query which searches in the request URL:
|
|
Results
You can find all the results on the results page by selecting “Test: logs10m”.
Remember that the only high quality metric is “Fast avg” since it guarantees low coefficient of variation and high queries count conducted for each query. The other 2 (“Fastest” and “Slowest”) are provided with no guarantee since:
- Slowest - is a single attempt result, in most cases the very first coldest query. Even though we purge OS cache before each cold query it can’t be considered stable. So it can be used for informational purposes only (even though many benchmark authors publish such results without any disclaimer).
- Fastest - just the very fastest result, it should be in most cases similar to the “Fast avg” metric, but can be more volatile from run to run.
Remember the tests including the results are 100% transparent as well as everything in this project, so:
- you can use the test framework to learn how they were made
- and find raw test results in the results directory.
Unlike other less transparent and less objective benchmarks we are not making any conclusions, we are just leaving screenshots of the results here:
3 competitors with no tuning at once

Unfortunately Elasticsearch timed out for 2 queries, hence they were excluded from the final score calculation.
Elasticsearch with no tuning vs Manticore Search (default row-wise storage)
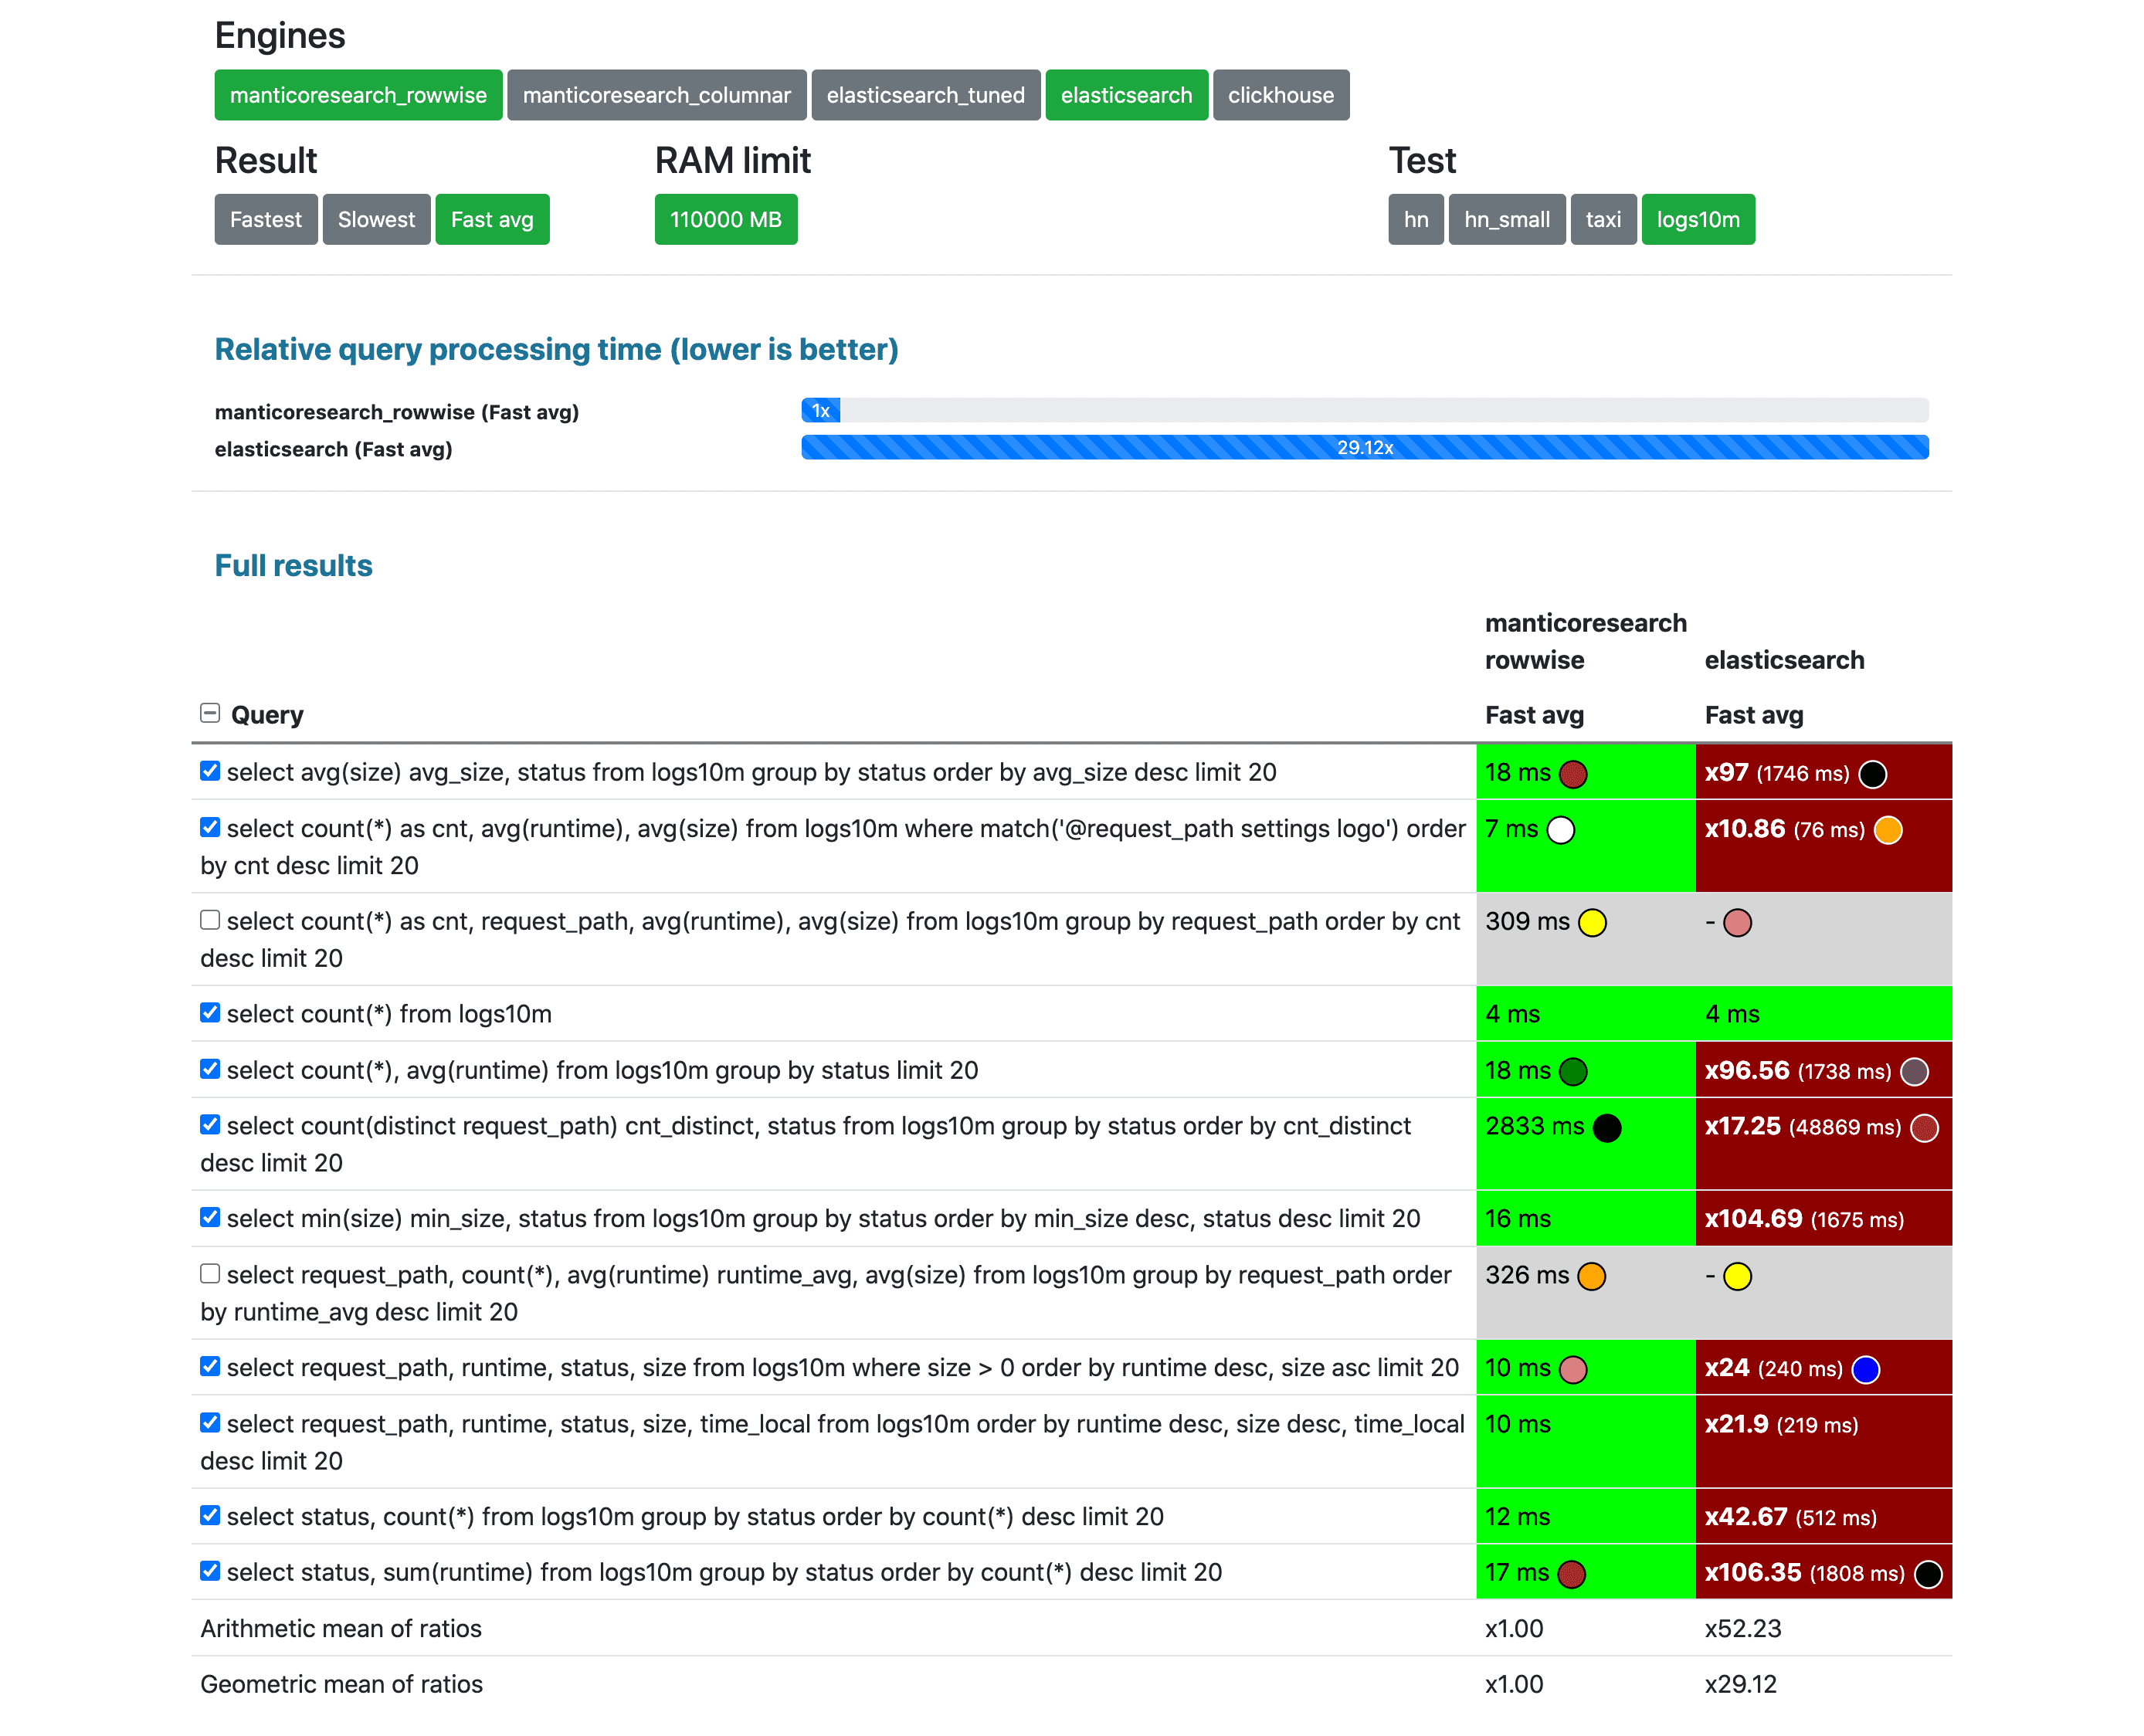
Unfortunately Elasticsearch timed out for 2 queries, hence they were excluded from the final score calculation.
Elasticsearch with no tuning vs tuned
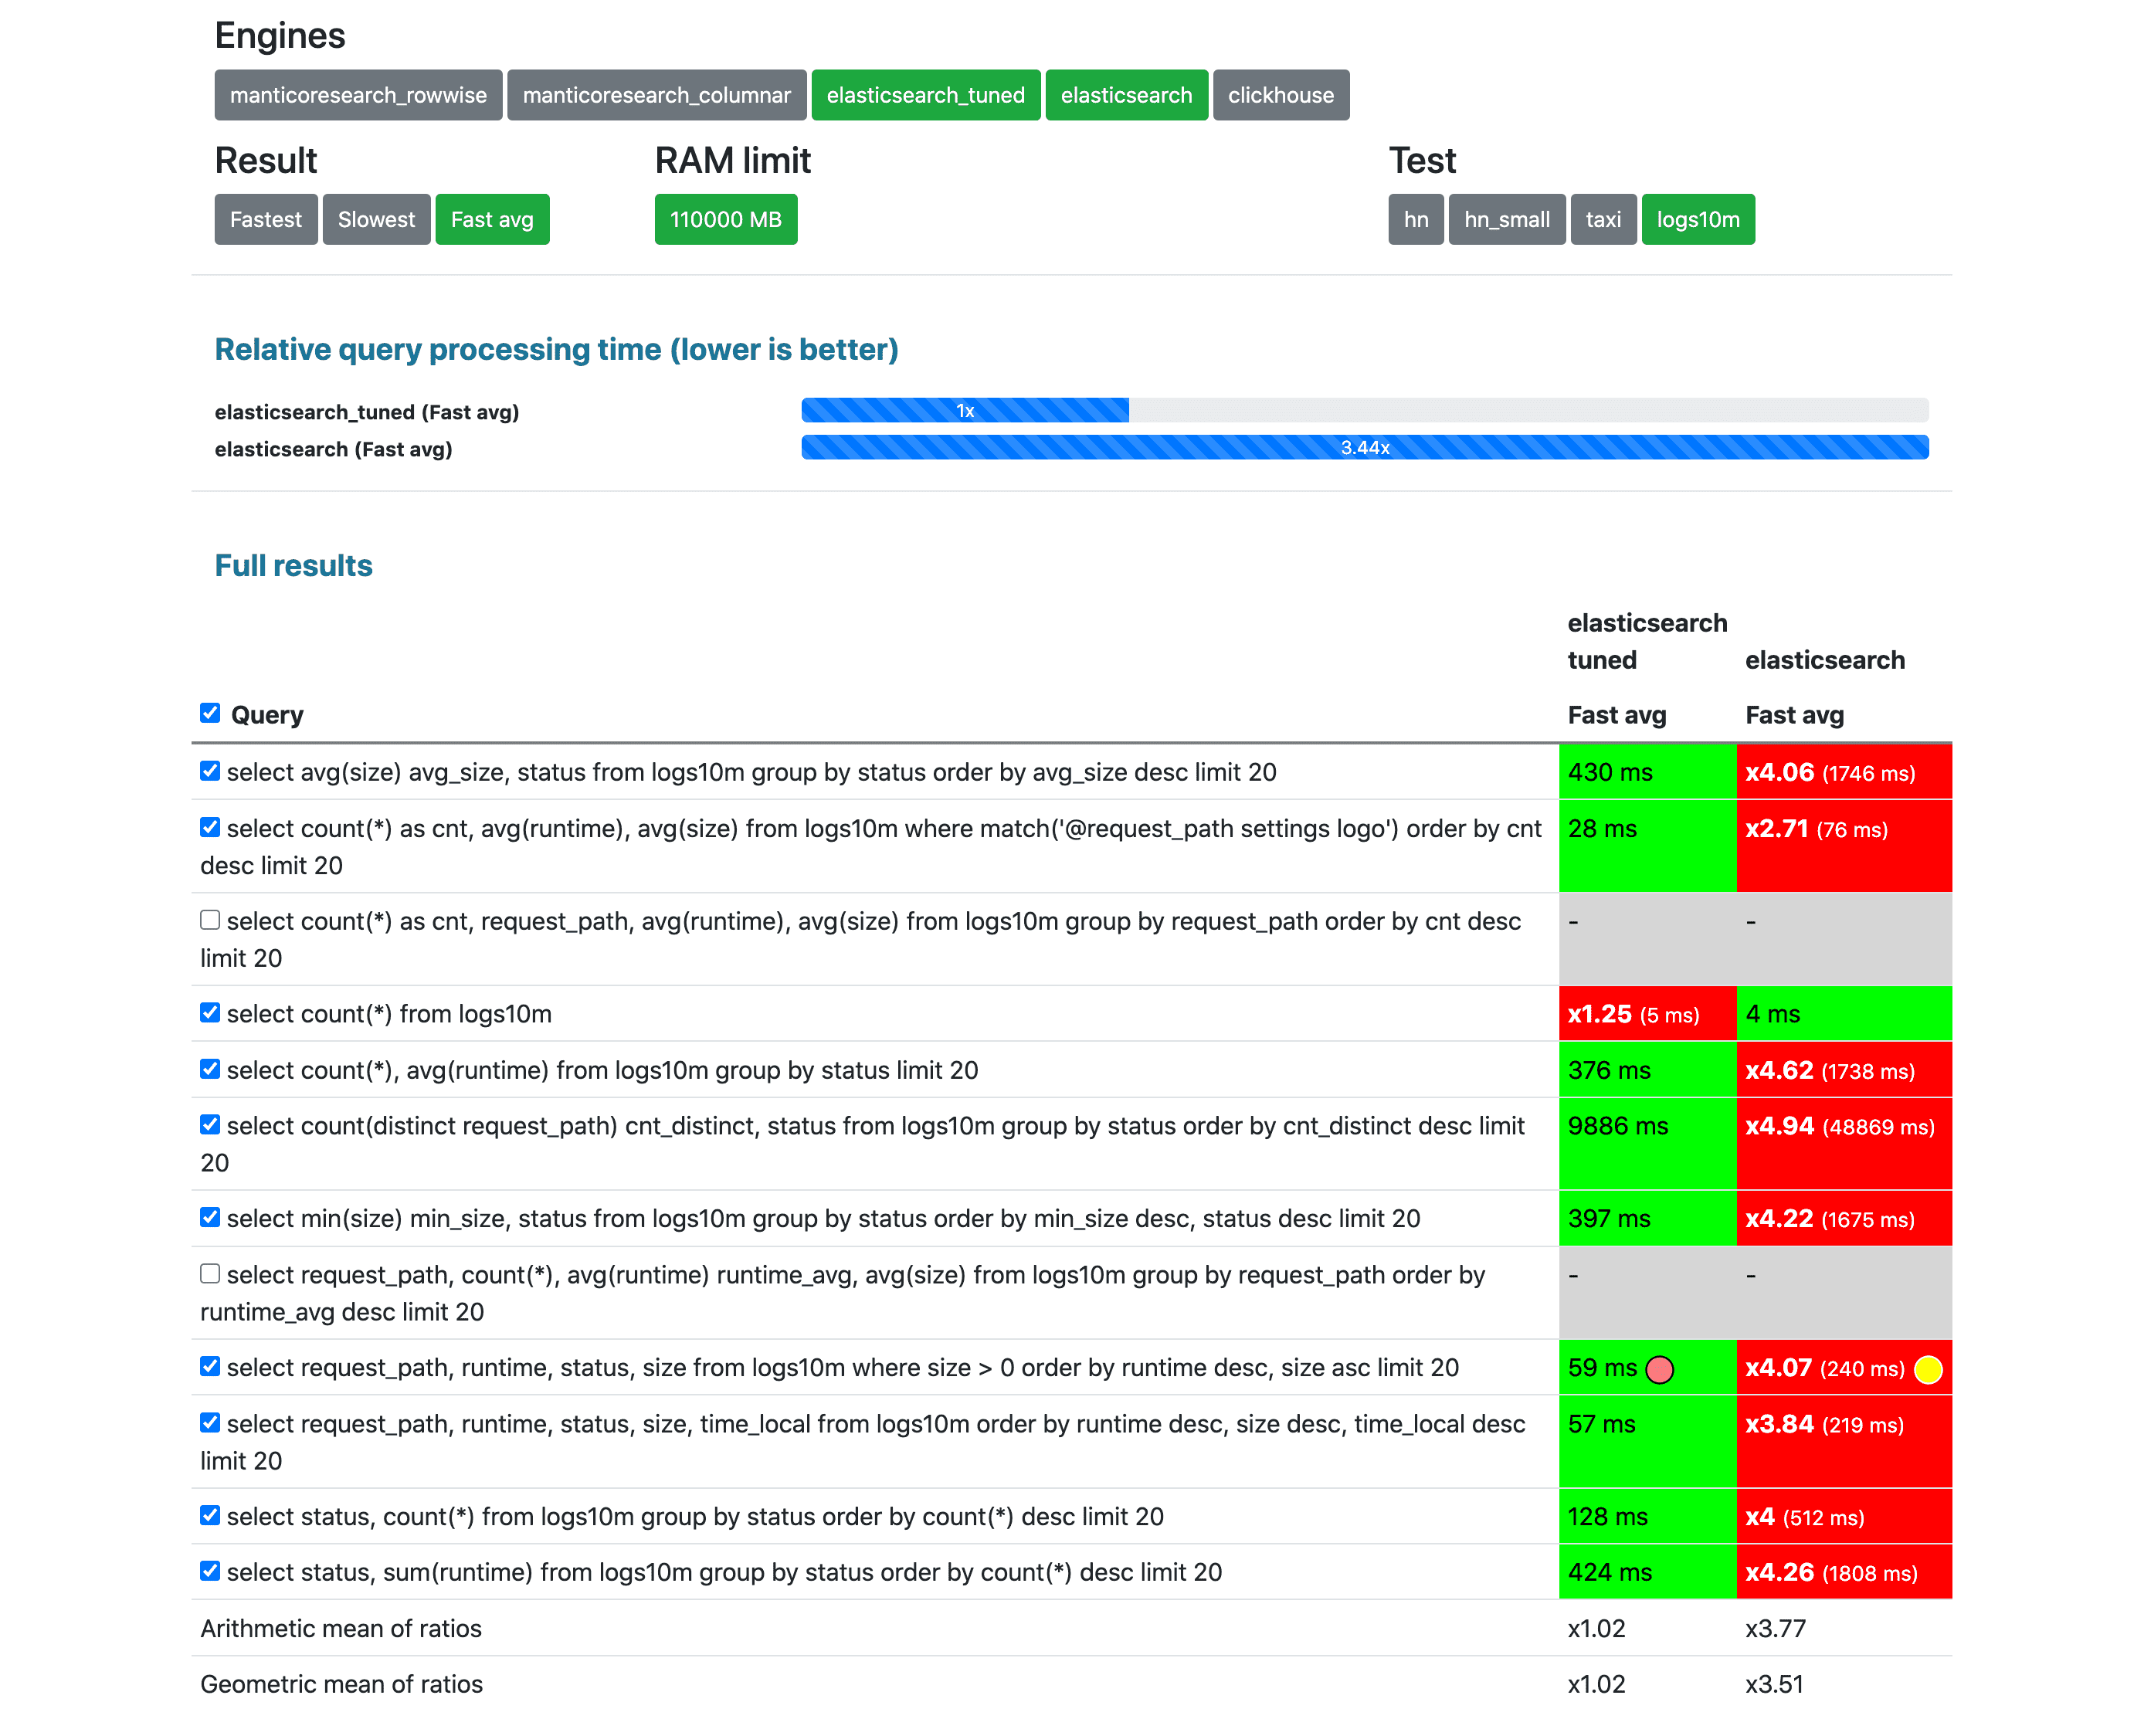
Unfortunately Elasticsearch timed out for 2 queries, hence they were excluded from the final score calculation.
Elasticsearch tuned vs Manticore Search (default row-wise storage)
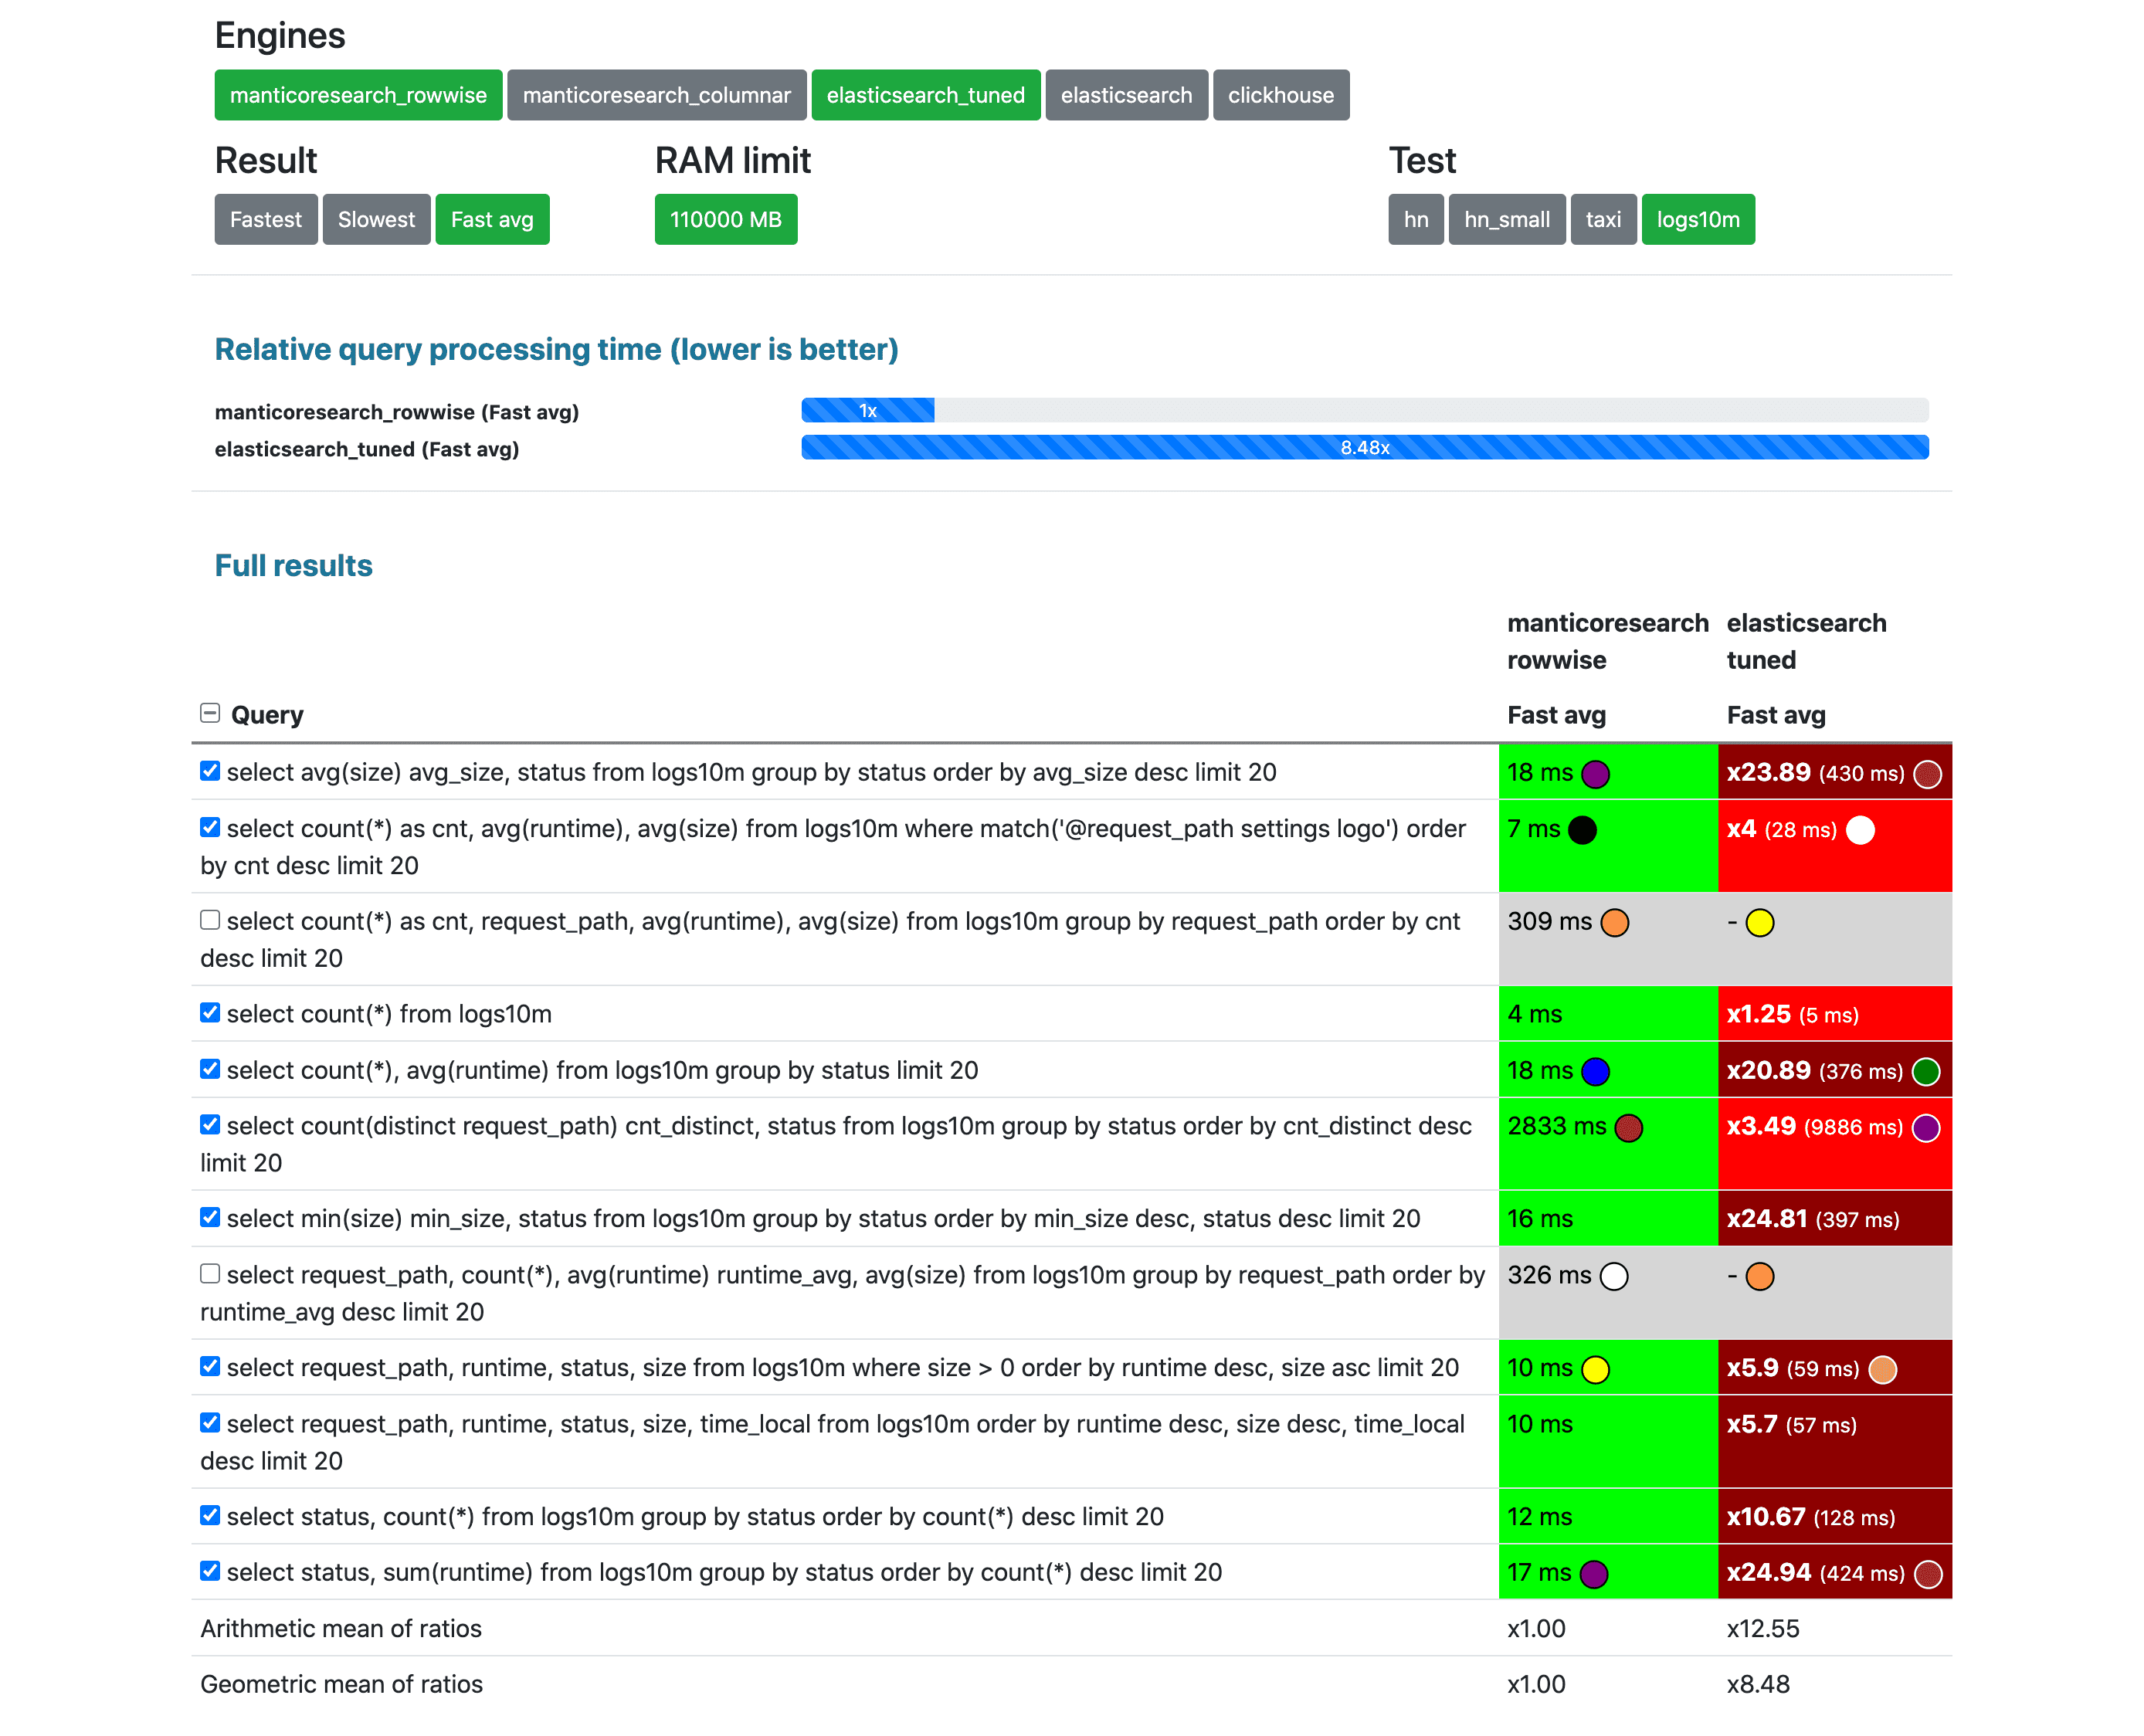
Unfortunately Elasticsearch timed out for 2 queries, hence they were excluded from the final score calculation.
Elasticsearch tuned vs Manticore Search (columnar storage)
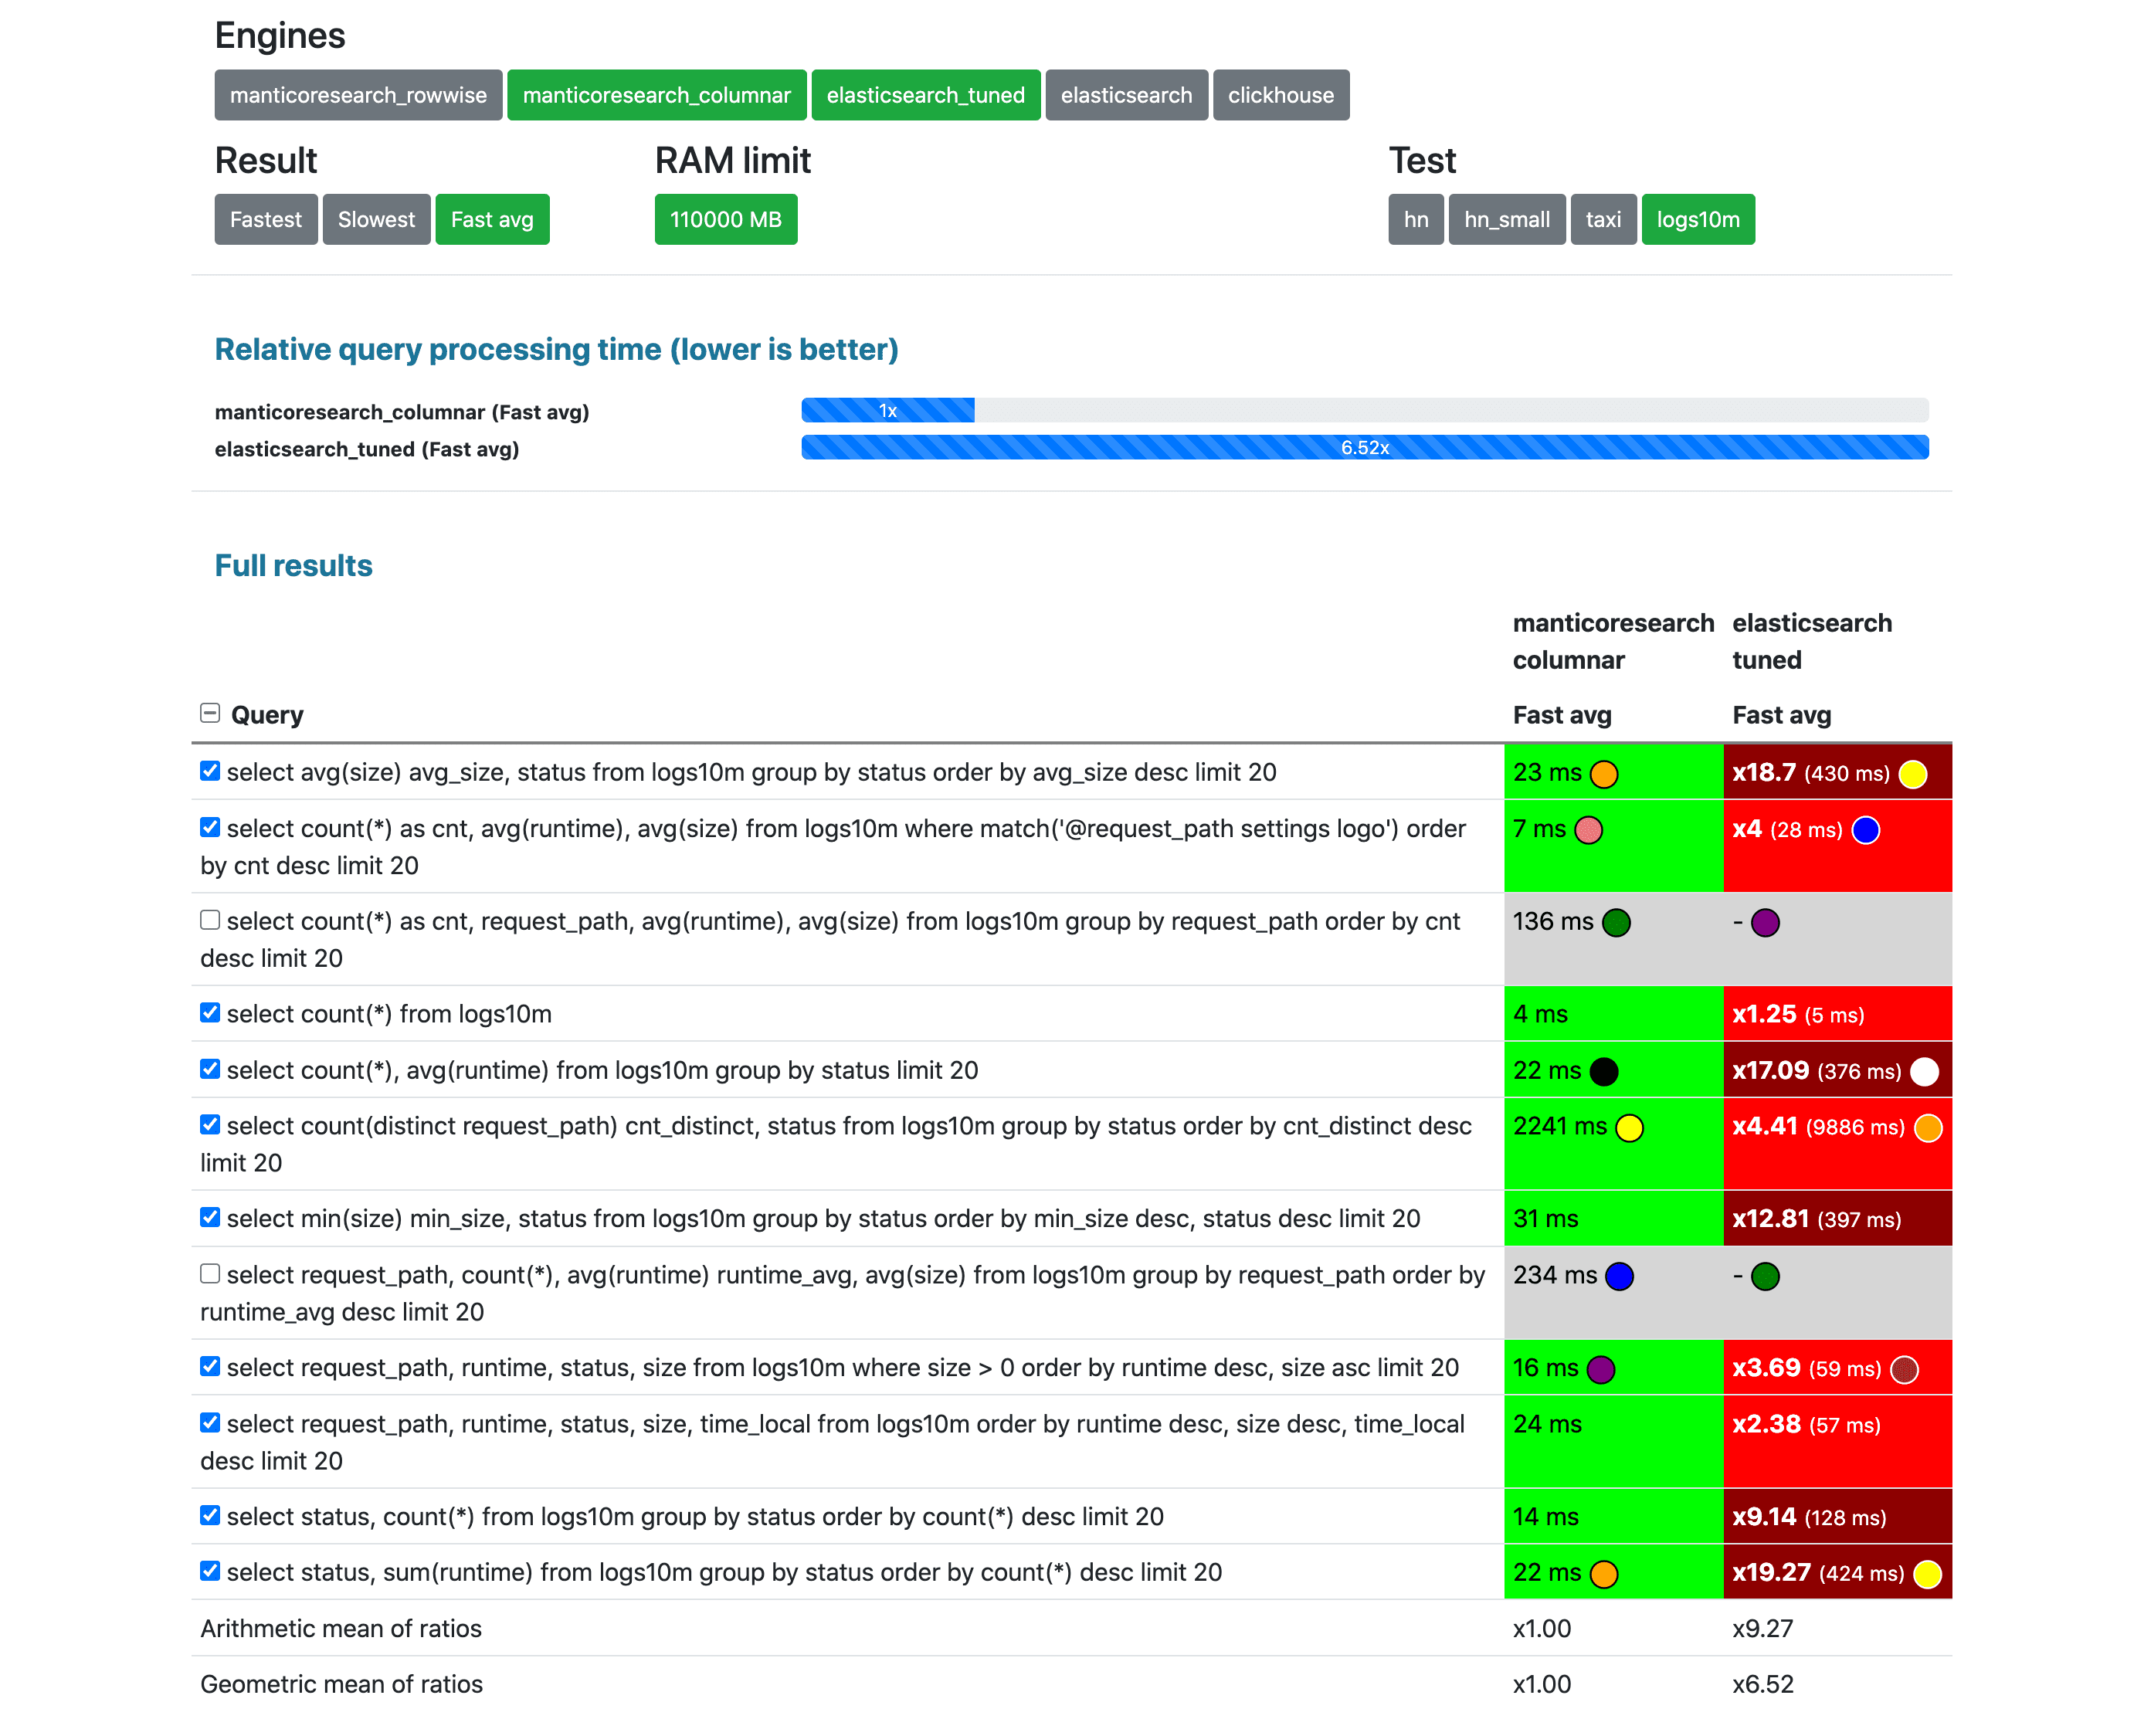
Unfortunately Elasticsearch timed out for 2 queries, hence they were excluded from the final score calculation.
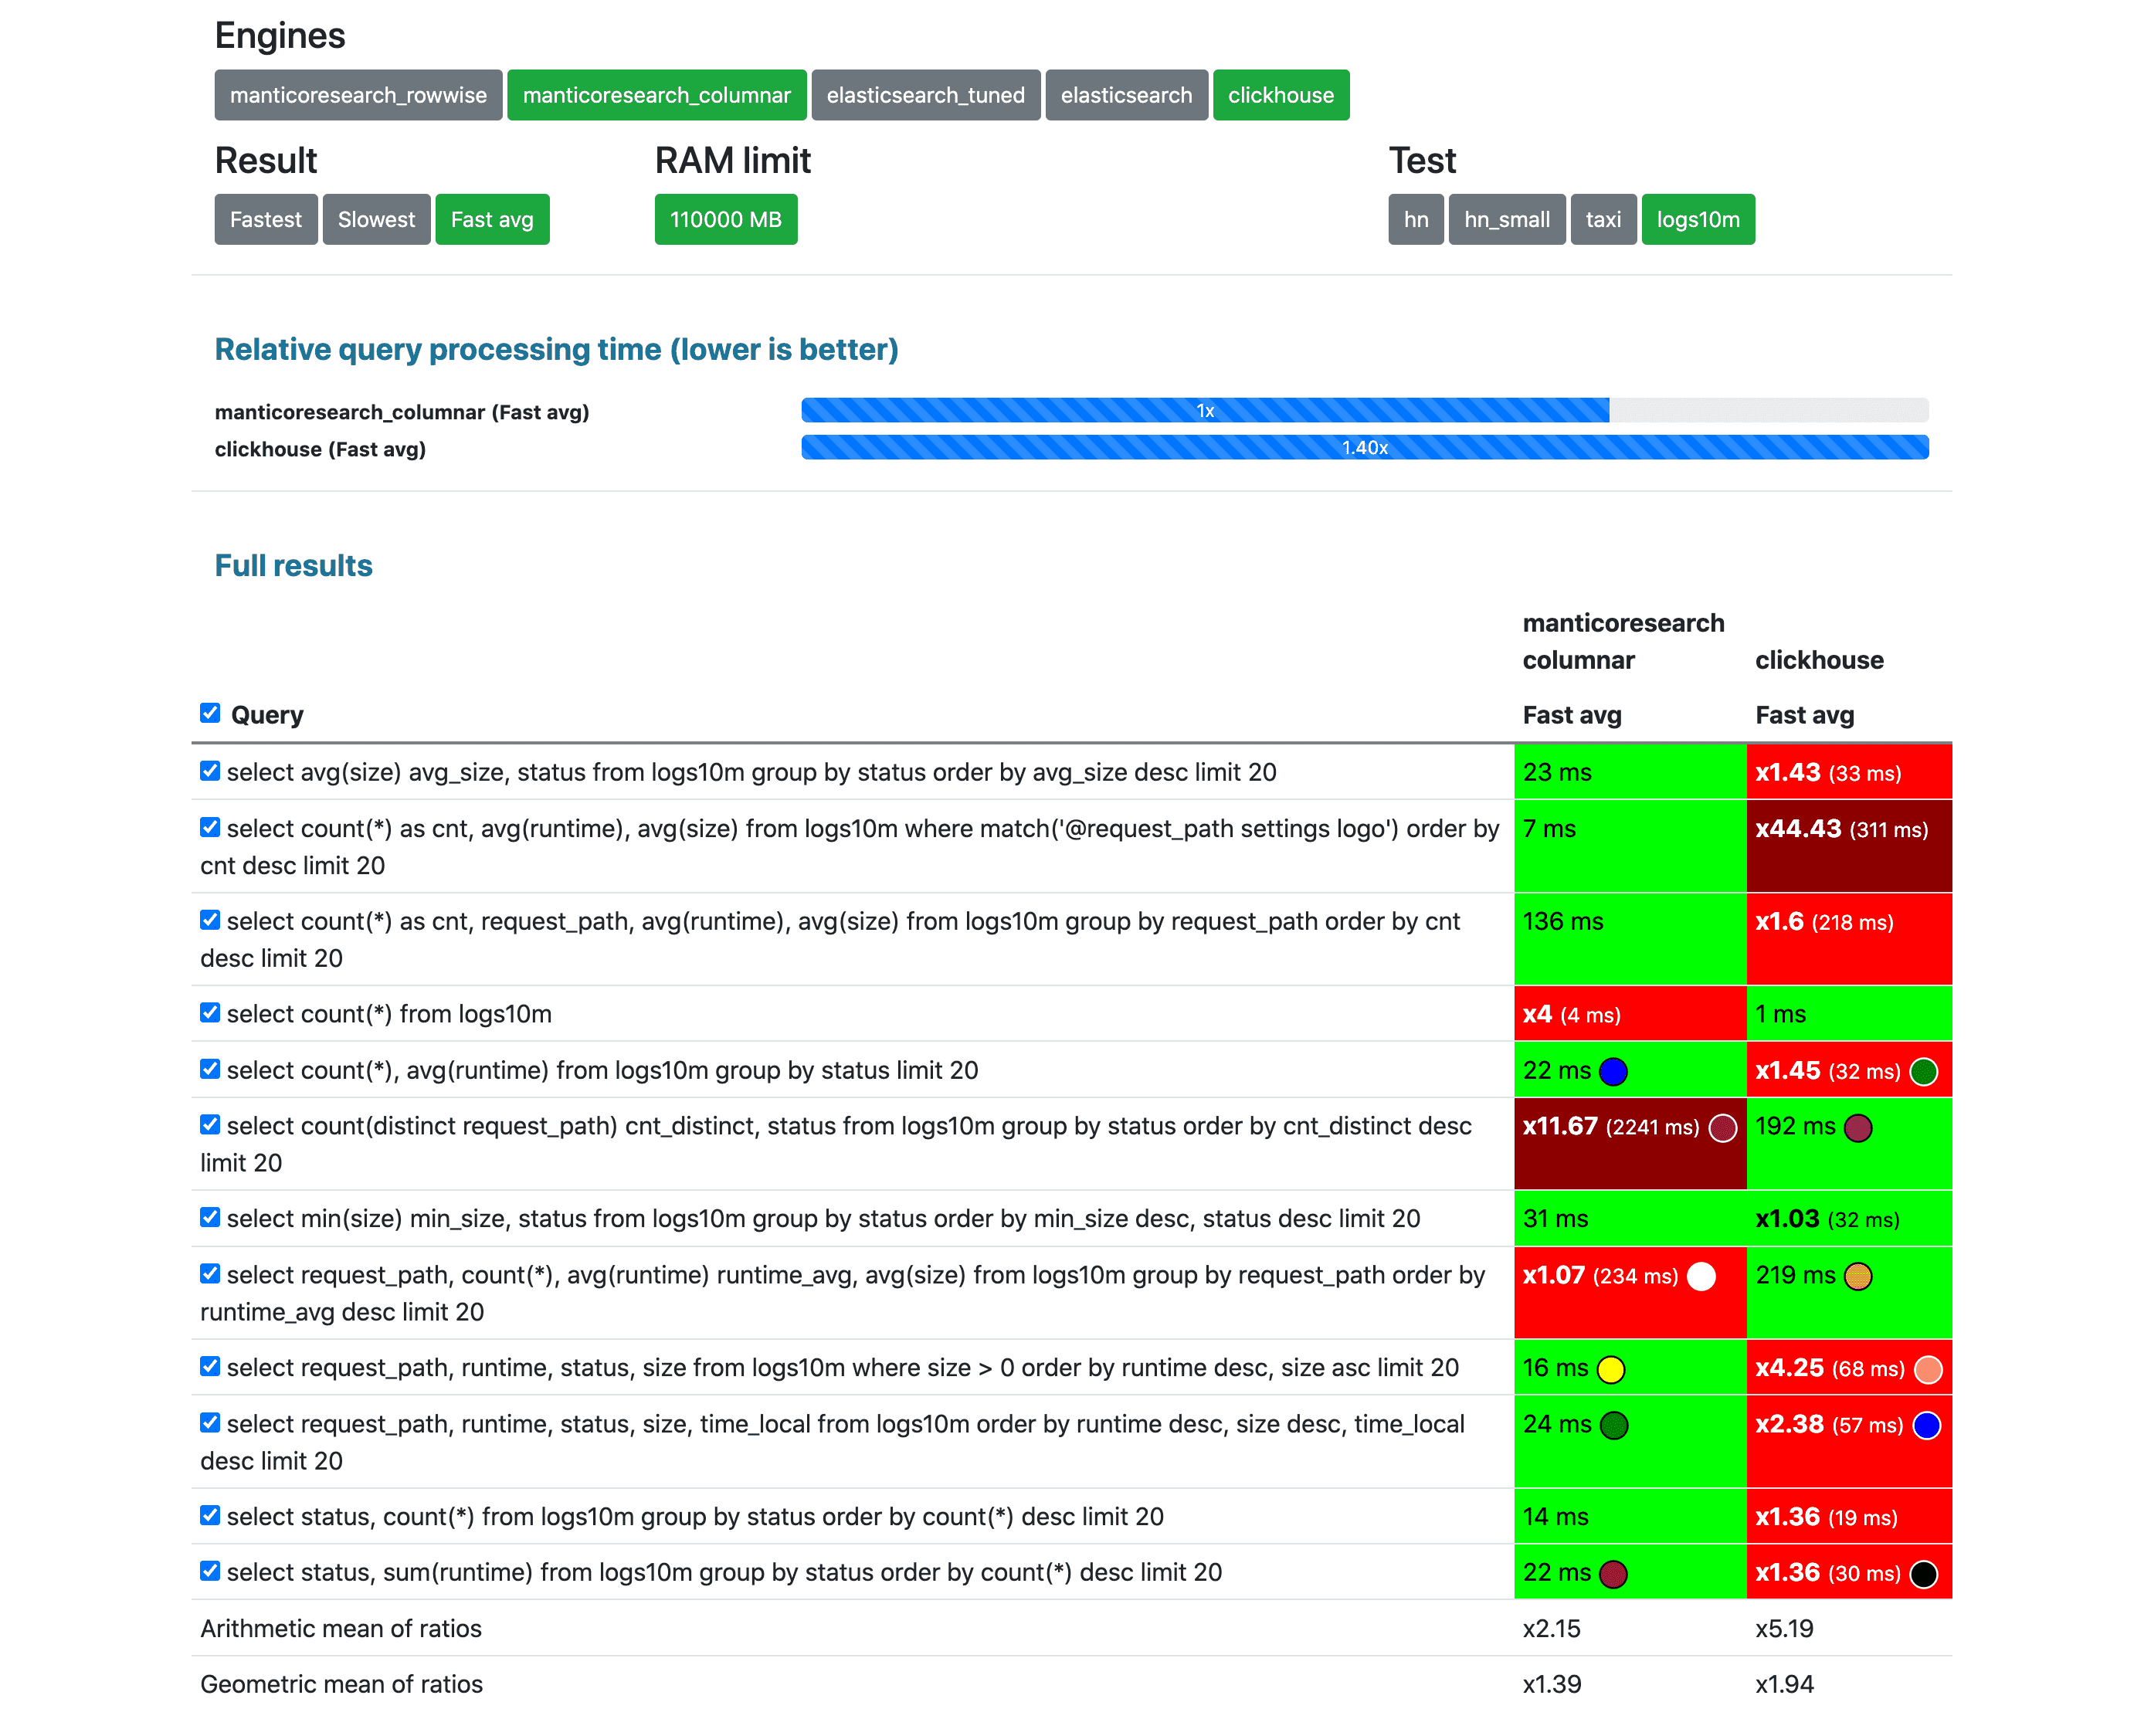
Clickhouse vs Manticore Search (columnar storage)
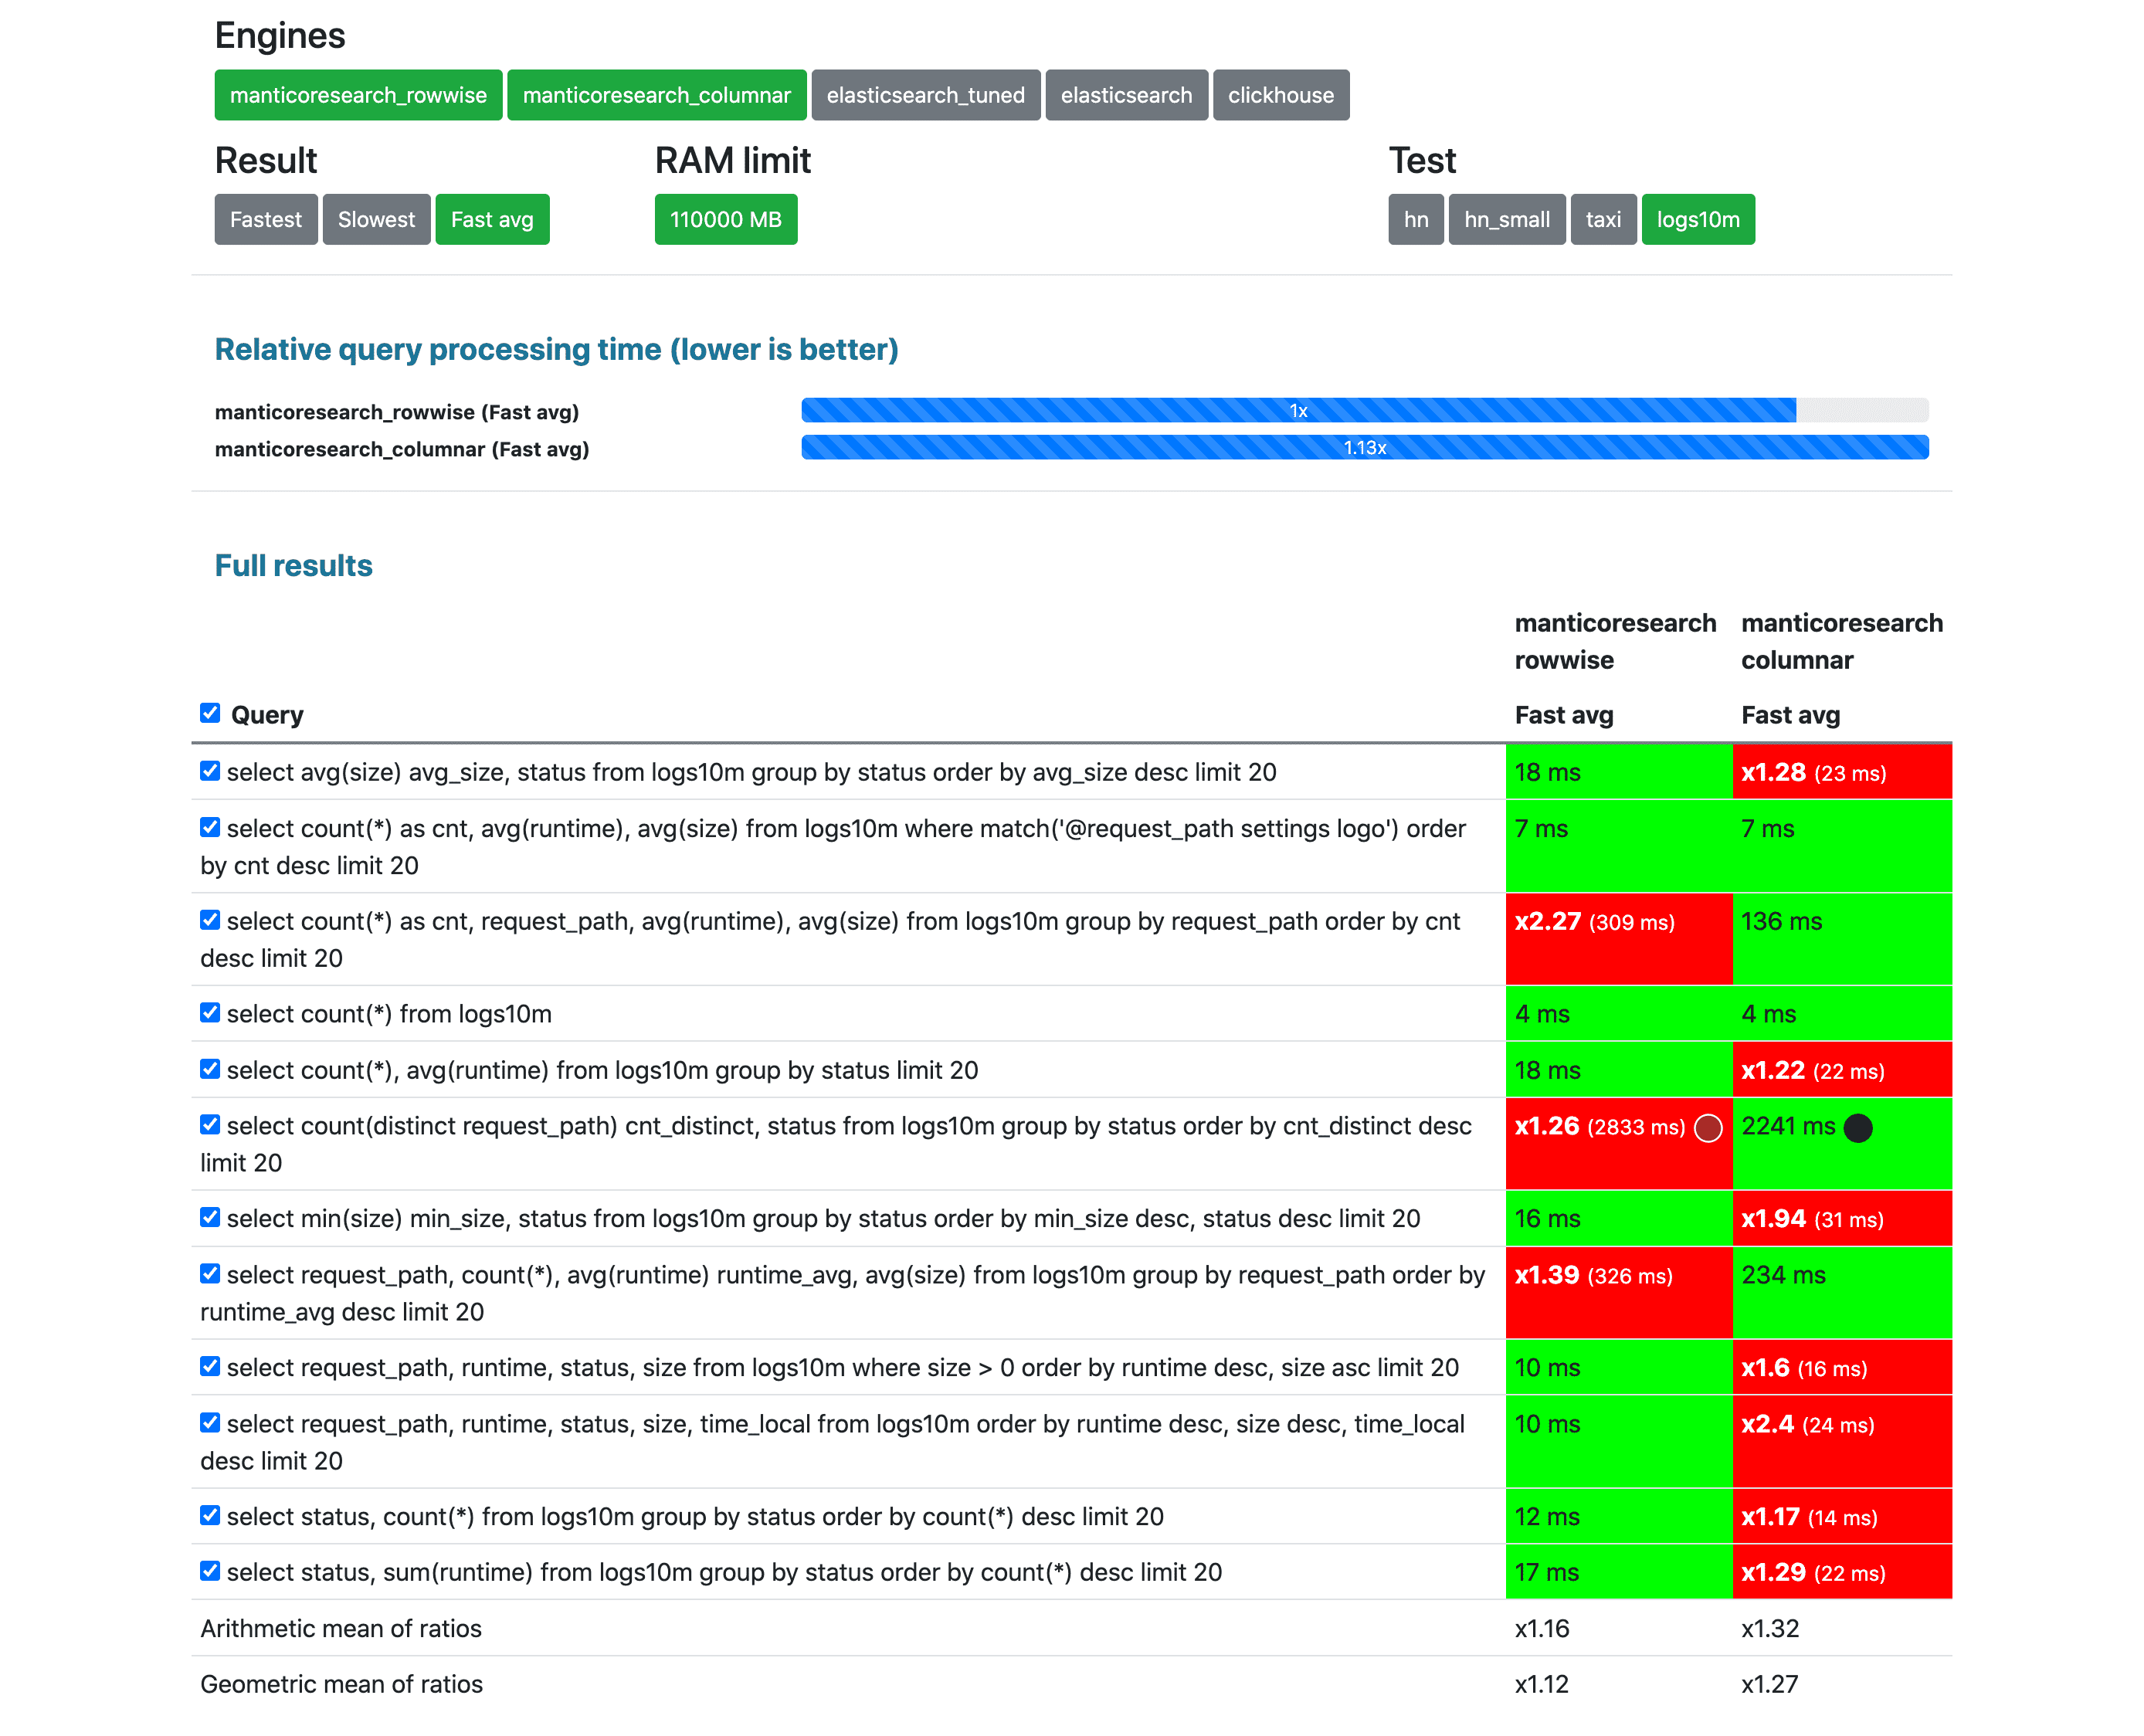
Manticore Search row-wise vs columnar
Disclaimer
The author of this test and the test framework is a member of Manticore Search core team and the test was initially made to compare Manticore Search with Elasticsearch, but as shown above and can be verified in the open source code and by running the same test yourself Manticore Search wasn’t given any unfair advantage, so the test can be considered unprejudiced. However, if something is missing or wrong (i.e. non-objective) in the test feel free to make a pull request or an issue on Github . Your take is appreciated! Thank you for spending your time reading this!
